
Should Your Nonprofit Hire, Buy, or Bootstrap Data Analytics? The Founder’s Guide
For most nonprofit founders, the pressure to “fix data” never arrives gently. It usually hits at once: a donor asking for deeper evidence, a report getting delayed because numbers don’t match, or a programme expanding faster than the systems that support it.
With limited budgets, lean teams, and rising expectations, it is easy to feel overwhelmed by the weight of data.1
At this point, founders usually see three possible paths:
To hire a data analyst, to buy an M&E or analytics software platform, or to bootstrap using internal talent and free tools, All three look like reasonable solutions. But the choice you make here shapes your organisation’s sustainability far more than most people realise.2
Bootstrapping is often misunderstood as the “cheap” option; in reality, it is the sequenced option, a disciplined way of building capability before committing to heavy tools or new hires.
This decision is tricky because it is not really about tools or staffing. It’s about capacity. A hired analyst can become a single point of failure. A software platform can sit unused if the team isn’t ready for it. And a DIY system can collapse under scale if the right skills and discipline aren’t in place.3
Through a DT4SI lens, this becomes a question of mindset: Are you building a point solution for today’s reporting problem or building an ecosystem of people, processes, and tools that grow with you?
This tension became real for Lend A Hand India (LAHI) when their vocational education programme expanded across states. Their data needs multiplied, but their existing systems hadn’t grown with them. They had to decide on hiring, buying, or bootstrapping, and their choice reveals why capability-first thinking matters more than the technology itself.4
The Cost–Benefit Reality Check
Once founders recognise the need to strengthen their data systems, the next question becomes practical: What is the smartest way to invest in limited resources? Each of the three common paths by hiring, buying software, or bootstrapping carries real costs, hidden implications, and very different long-term effects.5
Hiring a Data Analyst for Nonprofit Data Analytics: High Cost, Narrow Scope
On paper, hiring feels like the most straightforward solution. In practice, a full-time analyst can cost ₹6–15 lakh a year, and even then, their scope is limited.
Most analysts can analyse data, but they cannot solve deeper system issues like inconsistent field inputs or unclear indicators. Retention is also challenging; analysts often leave within a year, taking institutional memory with them.
Hiring without organisational maturity often creates dependency rather than capability.
Buying M&E Tools and Impact Tracking Software: Fast Setup, Slow Adoption
Enterprise M&E tools promise automation, dashboards, and standardisation. However, these benefits come with integration overheads, training requirements, and ongoing vendor dependency. Customisation cycles can be slow; field teams may resist new workflows, and annual licences (₹1–4 lakh) add recurring pressure. A platform is valuable, but only when the organisation is ready to use it well.6
Bootstrapping Nonprofit Data Analytics Using Internal Teams
Bootstrapping with free or low-cost tools reduces financial risk but increases time investment. Teams need upskilling, processes need discipline, and leaders need patience. The payoff is internal capability, but only if the organisation commits to it. Research across nonprofits shows capacity building and data hygiene ("Data hygiene" refers to keeping your data clean, organized, and free from errors) matter more than early platform adoption.7
When Each Path Makes Sense
In reality, each option fits a different maturity stage. Early-stage teams thrive with bootstrapping. Mid-stage teams often need a hybrid. Mature organisations benefit from hiring or buying. Frameworks like Gartner’s and McKinsey’s analytics maturity models provide useful lenses for deciding when to shift.8
The Hidden Costs
Choosing too early, or for the wrong reasons, creates technical and cultural debt. The wrong decision now becomes tomorrow’s bottlenecks, such as longer reporting cycles or vendor lock-in9.
The Bootstrap Analytics Stack
For many nonprofits, the most sustainable starting point is not a big hire or a big platform, but a lean, disciplined analytics stack built with tools the team already understands. The challenge isn’t finding tools; it’s assembling them into a simple system that reliably converts field data into meaningful insights.10
A strong bootstrap system follows a clear flow:
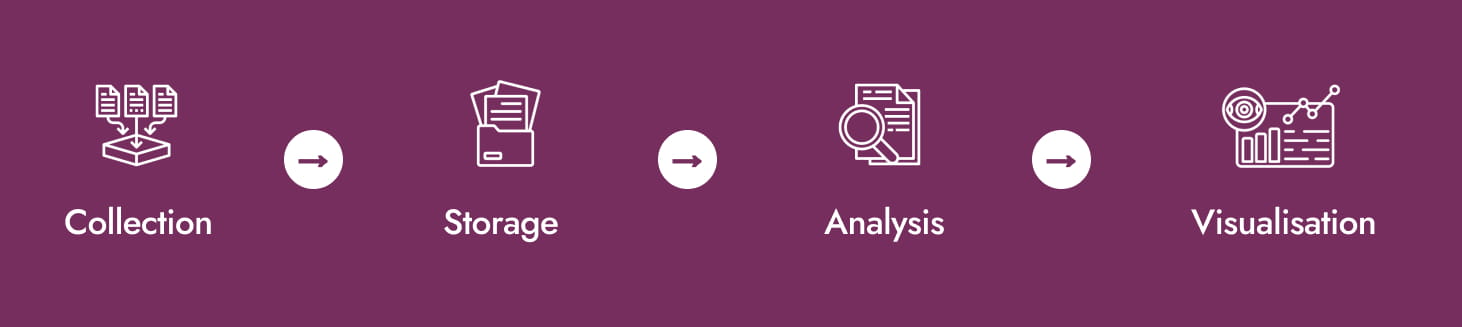
1. Collection Tools: Getting Clean Data from the Field: Free and accessible tools often work best at this stage: Google Forms for standardised surveys, KoboToolbox for offline or rural settings, and SurveyCTO (free tier) for structured programme data. These tools reduce variation and make field processes repeatable.11
2. Storage Tools: Keeping Data Organised and Accessible: The goal is not complexity; it is consistency: Google Sheets for centralised master data and Airtable (free plans) for lightweight databases. Notion for programme-level logs. The focus is on creating a single source of truth the whole team trusts.
3. Analysis Tools: Turning Raw Data into Insight: You don’t need data science to get started: Excel/Google Sheets pivot tables, Basic SQL via SQLite Studio, Jupyter Lite for simple Python-based analysis. Many studies show that around 70-80% of the questions can be answered with simple analyses.12
4. Visualisation Tools: Making Insights Easy to Use: Dashboards need to be understood, not to impress. Google Data Studio (Looker Studio), Power BI Desktop, and Datawrapper for public-friendly visuals. These make reporting accessible to partners and leadership.13
Selection Criteria
Choose tools based on organisation size, technical comfort, data volume, integration needs, and how distributed your field teams are.
Case Study: How Lend a Hand India Built a Lean, Scalable Stack
Lend A Hand India avoided costly platforms and instead created a disciplined bootstrap stack:
- Google Forms for standardised school-level inputs
- Google Sheets as the central repository with version control
- State-wise analysis templates to simplify comparisons
Looker Studio dashboards for government partners and donors. Their rationale was simple: the organisation needed clarity and consistency, not complexity.14
By choosing tools everyone could use, LAHI ensured adoption across states and built internal capability before investing in heavier systems.
Building Capacity to Bootstrap Successfully
Even the best tools fail without the skills and habits needed to use them well. This is the biggest blind spot in nonprofit analytics.
Founders often assume that choosing the right software or setting up a clean sheet will “fix data.” But tools do not create insight; people do.
Without shared skills, data discipline, and clarity on roles, even the simplest system collapses under real-world pressure.
That’s why bootstrapping is not just a technical approach; it’s a capability-building strategy. And capability grows through intentional, structured upskilling.
Upskilling Pathways That Actually Work
A practical learning stack often includes:
- DT4SI capability-building programmes on data systems, process discipline, and digital foundations
- Google’s free courses on Sheets, Forms, and basic visualisation
- Coursera pathways for Excel basics, data literacy, and introductory analysis
- Internal peer learning (“data hours,” weekly clinics, review cycles)
The goal isn’t to create data scientists. It’s to ensure that every team member becomes confident with the organisation’s core workflows.
How Long Does It Take?
With focused effort:
- 2–3 weeks → comfort with data entry and standard templates
- 6–8 weeks → ability to clean data and produce basic analysis
- 3 months → team-level fluency with reporting cycles
- 6+ months → an organisation that operates with evidence, not instinct. These timelines match field experiments documented in sector reports on capability building.15
Roles and Learning Paths
Programme managers
data quality, interpretation, decision-making
Field staff
accurate collection, consistent formats
Operations team
system maintenance, checks, documentation
Leadership
using insights into planning and governance.16
Case Study: How Lend a Hand India Built Capability
Lend A Hand India didn’t outsource analytics; they grew it from within. Their teams were trained in standard formats, school-level data templates, basic analysis steps, and dashboard interpretation.
Over time, teachers, coordinators, and programme leads all learned to use data in their daily decisions, making analytics a shared responsibility, not a specialised function.17
The 90-Day Implementation Roadmap
A bootstrap analytics system does not require years of planning. With focus and discipline, most nonprofits can establish a strong, reliable data backbone in just 90 days. The goal is not perfection; it is rhythm, clarity, and confidence. Once those foundations are in place, the organisation can iterate and strengthen over time.
Phase 1 (Weeks 1–4): Audit and Tool Selection
The first month is about understanding reality. Map how data currently enters the organisation, identify inconsistencies, and list indicators that matter. This audit becomes the anchor for choosing tools that fit your team’s capacity, not the other way around. A small set of simple, interoperable tools is usually enough to get started.
Phase 2 (Weeks 5–8): Staff Training and a Small Pilot
Before scaling, teams need time to practice. A focused pilot in one programme, one region, or with one workflow helps to identify friction points early. During this phase, staff learn how to collect, clean, and interpret data using new tools. The aim is to build confidence, not complexity.
Phase 3 (Weeks 9–12): Rollout with Feedback Loops
Once the pilot stabilises, expand the system across programmes. Weekly review cycles help surface errors, refine formats, and ensure consistency. This is where insights begin to emerge, and leadership starts using data regularly.
Phase 4 (Ongoing): Iteration and Culture Building
The final phase is continuous. As teams get comfortable, introduce small improvements like clearer templates, automated checks, and simplified dashboards. Over time, evidence becomes part of daily operations, not an afterthought.18
Common Pitfalls and How to Avoid Them
Moving too fast, overcomplicating tools, skipping training, and running parallel manual systems are the most common blockers. Discipline and simplicity are your strongest safeguards.
Case Study: Lend A Hand India’s 90-Day Journey
Lend A Hand India followed this exact phased approach of piloting in select schools, refining formats, and then scaling across states. Their discipline in the early weeks ensured smooth adoption later, making analytics a natural part of their programme delivery rather than an external requirement.
Measuring Return on Investment (ROI) and Impact
A stronger data system is not just a technical upgrade, and it is an organisational return on investment. Unlike financial ROI, the value of analytics is shown quietly, through better decisions, smoother operations, and stronger relationships with stakeholders. When nonprofits measure this correctly, they begin to see data not as a cost centre but as a strategic infrastructure.
Cost Avoidance: Savings That Don’t Show Up on Spreadsheets
The most immediate ROI of a bootstrap approach is cost avoidance. By delaying premature hiring or expensive software purchases, organisations often save ₹10–20 lakh a year. Clean workflows also reduce time spent fixing errors, re-running reports, or managing last-minute donor requests, the hidden costs that drain teams more than budgets.
Efficiency Gains Across the Organisation
A disciplined data system speeds up everything:
- Faster reporting cycles
- Fewer revisions
- Smoother coordination between field and programme teams
- Quicker decision-making during implementation
- What previously took weeks often reduces to days.
Programme Improvement Through Real-Time Insight
Better data highlights what’s working, where gaps exist, and how performance varies across locations. It allows programme teams to spot trends early, respond quickly, and improve interventions with evidence rather than instinct.19
Stronger Donor Engagement
Donors respond to clarity. When nonprofits present consistent, comparable, and timely data, conversations shift from reporting to strategy. Renewals become smoother, and organisations gain the confidence to approach larger institutional funders.
When to Revisit Hire–Buy–Bootstrap
You should reconsider your approach when:
- Data volume overwhelms current systems
- Automation becomes essential
- Reporting cycles become bottlenecks
- Predictive insights are needed for scale
Bootstrap is the beginning, not the end.
Case Study: Lend A Hand India’s Measurable Results
Lend A Hand India saw tangible improvements after building their internal capability. Reporting turnaround times dropped, school-level insights became clearer, and dashboards strengthened state government partnerships. Their capability-first approach created long-term ROI and more confidence, more clarity, and more control over their data ecosystem.
From Tools to Organisational Transformation
When nonprofits begin their analytics journey, it’s easy to focus on tools. But the real transformation happens when teams start thinking, working, and deciding with data, not because they are asked to, but because it becomes part of who they are. This is the deeper outcome of the bootstrap approach. It doesn’t just install systems; it cultivates ownership.
Building Internal Ownership, Not Dependency
Bootstrapping forces teams to understand their own data flows, question their own assumptions, and take responsibility for the quality of what they produce. Instead of outsourcing insight to a vendor or a single analyst, organisations build shared capability.
This creates resilience. When people move or partners change, the organisation retains its intelligence, not just its files.
Data Culture vs. Data Dependency
Most nonprofits unintentionally create data dependencies where only one person or one platform holds the keys.
A mature organisation grows a data culture where field teams trust their numbers, programme teams use data to make decisions, and leadership uses evidence in planning dashboards that reflect reality, not wishful thinking. Culture, not software, is what sustains impact at scale.
Scaling Capability as the Organisation Grows
As programmes expand, the data backbone must expand with them. What starts as simple sheets can evolve into automated checks, advanced dashboards, or specialised analytics roles. Bootstrap is not the final stage; it is the launchpad that prepares organisations to adopt more sophisticated systems without chaos, rework, or over-dependence.
Case Study: Lend A Hand India’s Transformation
LAHI’s journey demonstrates this arc clearly. By starting small and aligning formats, training teachers and coordinators, and simplifying state-level reporting, they built confidence before complexity.
Over time, data became part of everyday conversations. Decisions became sharper. Partnerships strengthened. And importantly, their system became replicable across states, partners, and government ecosystems.
As organisations grow, their data systems must evolve with them. Bootstrap foundations can eventually give way to advanced dashboards, automated pipelines, or specialised analytics roles. But when capability comes first, these upgrades happen smoothly without chaos, rework, or fear of technology.
Their lesson is simple and universal:
When capability comes first, technology becomes an accelerator, not a crutch.
References
1. Data Orchard - State of the Sector: Data Maturity in the Nonprofit Sector 2023. Data Orchard
2. Salesforce.org - “76% of Nonprofits Lack a Data Strategy.” (Nov 2021). Salesforce
3. Bridgespan - A Practical Guide to Nonprofit Measurement, Evaluation and Learning. Bridgespan
4. McKinsey - Measuring What Matters in Nonprofits (insights & report). McKinsey & Company
5. OECD - Measure, Manage and Maximise Your Impact (2024). OECD
6. World Bank - World Development Indicators / Data360 resources. DataBank
7. DT4SI - Lend A Hand India case study page. dt4si.com
8. Lend A Hand India - organisational site. Lend a Hand India
9. NetHope - The Digital Nonprofit: Key Considerations for a Better Data Hygiene. NetHope
10. HBR - “Data-Driven Cultures Start at the Top” and related HBR pieces on data culture. Harvard Business Review
11. Glassdoor / Futurense - Data analyst salary benchmarks in India (2024–2025). Glassdoor
12. Microsoft Power BI - pricing and desktop (free tier) docs. Microsoft
13. Looker Studio (Google Data Studio) - product and docs (free tool). lookerstudio.google.com
14. Airtable - pricing, free/nonprofit plans. Airtable
15. KoboToolbox - community plan for nonprofits (free). KoboToolbox
16. SurveyCTO - pricing and plan notes. SurveyCTO
17. Datawrapper - free/paid visualization options and blog. Datawrapper
18. Gartner - Data & Analytics maturity frameworks and resources. Gartner
The information provided here is created as a community resource and is not intended as professional advice or a recommendation by ILSS or Koita Foundation. While we strive to ensure the accuracy of the content, we do not take responsibility for any errors or omissions. Users should use their own discretion before making any decisions based on this information. ILSS or Koita Foundation assume no liability for any actions taken based on the information provided.